
Data visualization plays a crucial role in making sense of complex information and presenting it in a more understandable format. Django, a popular Python web framework, is often used for building web applications that require dynamic data visualization. One of the powerful tools you can use for this purpose is Chart.js or HighCharts, a JavaScript library that allows you to create interactive and aesthetically pleasing charts and graphs. In this blog post, we’ll walk you through the process of using Chart.js or HighCharts in a Django project with practical examples.
Prerequisites
Before we dive into implementation, make sure you have the following prerequisites installed:
- Python and Django: You should have Python installed on your system. You can install Django using
pipwith the commandpip install django. - A Django Project: Create a Django project if you don’t have one already. You can do this with the command
django-admin startproject projectname. - Charts Libraries: We will include Chart.js and HighChart.js in our project, and you can either download it manually or include it via a content delivery network (CDN). For simplicity, we’ll use the CDN method in this example.
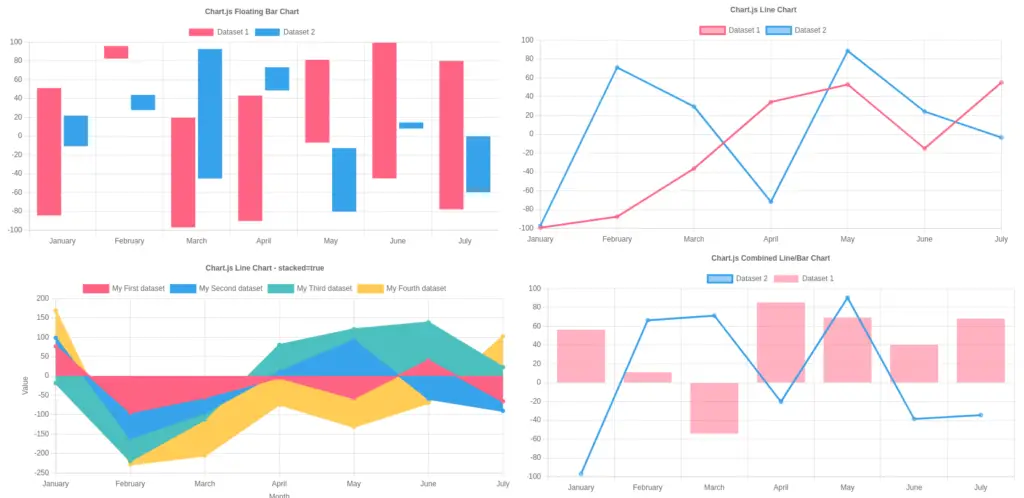
Learn more about different Chart Types on ChartJS or HighChartJS
Create Dynamic Charts in Django Template using Database
Step 1: Setting up the Django Project
- Create a Django App: Within your Django project, create a new app. Run the following command from your project’s root directory:
python manage.py startapp charts- Add the App to
INSTALLED_APPS: Open your project’ssettings.pyand add the newly created app to theINSTALLED_APPSlist:
# settings.py

INSTALLED_APPS = [
       # ...
       'charts',
       # ...
]- Create a Model (Optional): You can create a model if you want to visualize data from your database. For this example, we’ll create a simple model to store random data.
# charts/models.py

from django.db import models
from django.contrib import admin

class ChartData(models.Model):
    label = models.CharField(max_length=100)
    value = models.IntegerField()

    def __str__(self):
        return self.label + ' - ' + str(self.value)

admin.site.register(ChartData)- Migrate the Database: After creating the model, apply migrations to update the database schema:
python manage.py makemigrations
python manage.py migrate- Add Data to ChartData Model (Optional): Create a superuser for your app, and data to ChartData Model.
python manage.py createsuperuserRun your application using python manage.py runserver, and go to http://localhost:8000/admin, login with superuser username and password and Add Some data to that ChartData Model.
Step 2: Creating a View
Next, we’ll create a view in the charts app that will serve as the endpoint for our chart data.
# charts/views.py

from django.http import JsonResponse
from .models import ChartData

def chart_data(request):
    data = ChartData.objects.all()
    labels = [item.label for item in data]
    values = [item.value for item in data]

    chart_data = {
        'label': 'Line Chart',
        'labels': labels,
        'values': values,
        'chart_type': 'bar' # any chart type line, bar, ects
    }

    return JsonResponse(chart_data)
Step 3: Setting up URLs
Now, let’s configure the URL routing for our app by defining a URL pattern in the app’s urls.py file.
# charts/urls.py

from django.urls import path
from . import views

urlpatterns = [
    path('chart-data/', views.chart_data, name='chart_data'),
]
Include this URL configuration in your project’s main urls.py file.
# projectname/urls.py

from django.contrib import admin
from django.urls import path, include

urlpatterns = [
    path('admin/', admin.site.urls),
    path('', include('charts.urls')),
]
Step 3: Creating the Chart and Graphs
You can eaither create using Chart.js or HighCharts.js
Step 3.1: Create Chart using Chart.js
Now, let’s create a template that will display the chart using Chart.js. You can place this template in your app’s templates directory.
<!-- charts/templates/chart.html -->

<!DOCTYPE html>
<html lang="en">
<head>
    <meta charset="UTF-8">
    <title>Chart.js Example</title>
    <!-- Include Chart.js via CDN -->
    <script src="https://cdn.jsdelivr.net/npm/chart.js"></script>
</head>
<body>
    <div style="width: 50%; margin: 0 auto;">
        <canvas id="myChart"></canvas>
    </div>

    <script>
        document.addEventListener('DOMContentLoaded', function () {
            fetch('/chart-data/')
                .then(response => response.json())
                .then(data => {
                    const ctx = document.getElementById('myChart').getContext('2d');

                    new Chart(ctx, {
                        type: data.chart_type,
                        data: {
                            labels: data.labels,
                            datasets: [{
                                label: data.label,
                                data: data.values,
                            }]
                        },
                        options: {
                            scales: {
                                y: {
                                    beginAtZero: true
                                }
                            }
                        }
                    });
                });
        });
    </script>
</body>
</html>
Step 3.1: Create Chart using HighCharts.js
Now, let’s create a template that will display the chart using HighCharts.js. You can place this template in your app’s templates directory.
<!-- charts/templates/chart.html -->

<!DOCTYPE html>
<html lang="en">
<head>
    <meta charset="UTF-8">
    <title>Highcharts.js Example</title>
    <!-- Include Highcharts.js via CDN -->
    <script src="https://code.highcharts.com/highcharts.js"></script>
</head>
<body>
    <div style="width: 80%; margin: 0 auto;">
        <div id="chart-container"></div>
    </div>

    <script>
        document.addEventListener('DOMContentLoaded', function () {
            // Fetch data from your Django backend
            fetch('/chart-data/')
                .then(response => response.json())
                .then(data => {
                    Highcharts.chart('chart-container', {
                        chart: {
                            type: data.chart_type
                        },
                        title: {
                            text: data.label
                        },
                        xAxis: {
                            categories: data.labels
                        },
                        yAxis: {
                            title: {
                                text: 'Values'
                            }
                        },
                        series: [{
                            name: 'Chart Data',
                            data: data.values
                        }]
                    });
                });
        });
    </script>
</body>
</html>
Step 4: Displaying the Chart
To display the chart, you need to create a view that renders this template and set up a URL pattern for it.
# charts/views.py

from django.shortcuts import render
from django.http import JsonResponse
from .models import ChartData

def chart_data(request):
    data = ChartData.objects.all()
    labels = [item.label for item in data]
    values = [item.value for item in data]

    chart_data = {
        'label': 'Line Chart',
        'labels': labels,
        'values': values,
        'chart_type': 'bar'
    }

    return JsonResponse(chart_data)

def chart_view(request):
    return render(request, 'chart.html')<!-- charts/templates/chart.html -->
Learn More on Fetch and Display API JSON Response Data in Django Templates
Add a URL pattern for this view in the urls.py file of your app.
# charts/urls.py

from django.urls import path
from . import views

urlpatterns = [
    path('chart-data/', views.chart_data, name='chart_data'),
    path('chart/', views.chart_view, name='chart_view'),
]
Step5: Running the Django Development Server
Now that you’ve set up your view and template, you can run the Django development server:
python manage.py runserverVisit http://localhost:8000/charts/chart/ in your web browser to see the Chart.js or HighCharts chart displaying the data from your Django model.
Conclusion
In this blog post, you’ve learned how to integrate Chart.js or HighCharts into your Django project to create interactive and visually appealing charts. With Django’s powerful backend and Chart.js or HighCharts for frontend data visualization, you can build data-driven web applications that provide valuable insights to users. Experiment with different chart types and options to tailor your visualizations to your project’s needs. Happy coding!
Find this tutorial on Github.